FEA / ABAQUS · SOLID MECHANICS
Does the hook mesh change the answer?
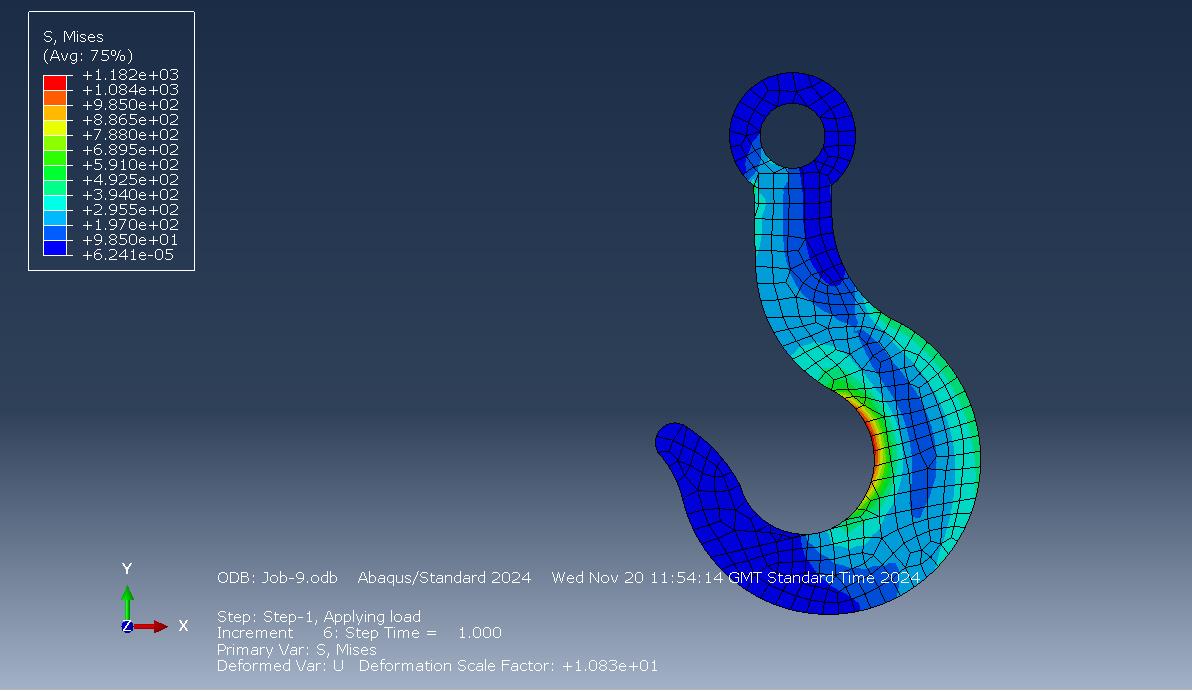
I modelled a loaded hook in Abaqus and compared element types and mesh densities. The focus was convergence: whether stress and displacement settle as the mesh is refined.
01 / MODEL
Geometry, support & load
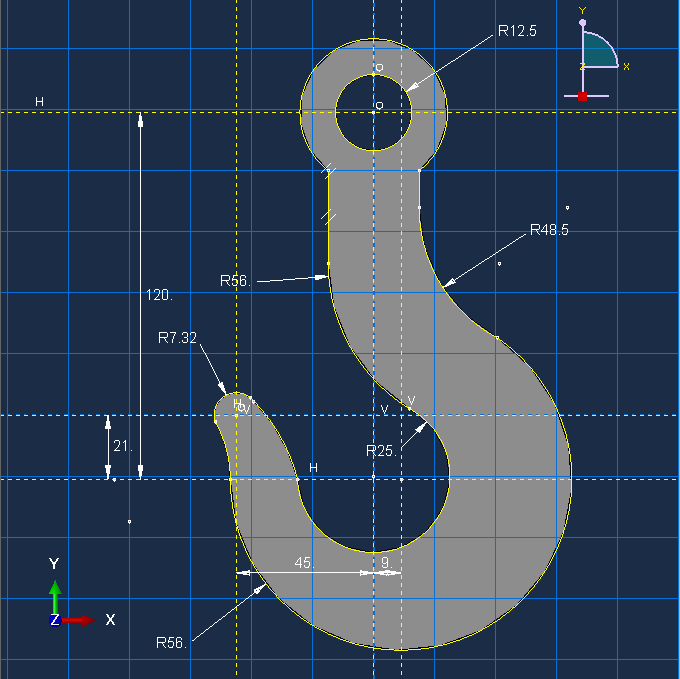
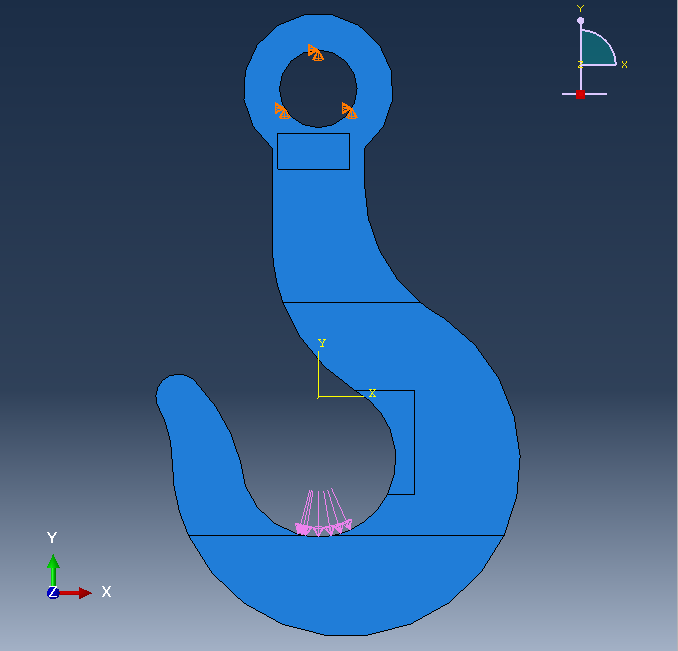
The hook was represented as a 2D plane-stress model. I fixed the upper support hole and applied pressure along the lower inner curve, then assigned low-carbon steel properties.
02 / METHOD
Refine where the result changes fastest
I partitioned the model to concentrate finer elements around the inner curve, where stress and displacement gradients were highest. The rest of the hook used a coarser mesh to keep the analysis manageable.
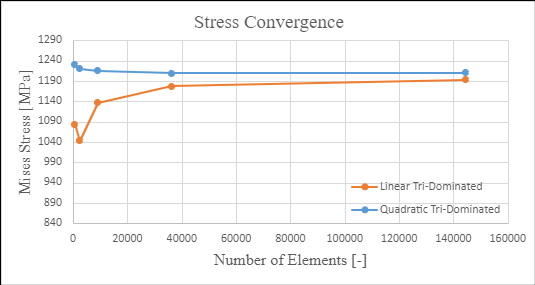
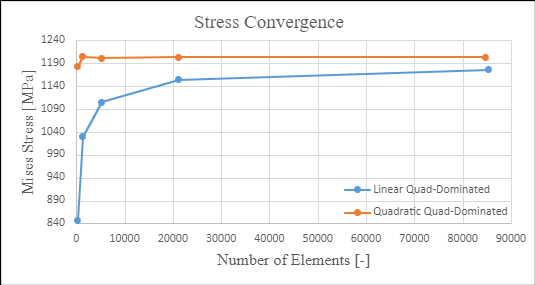
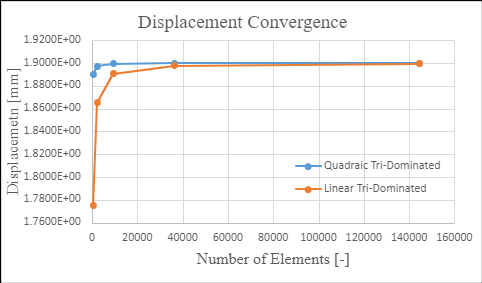
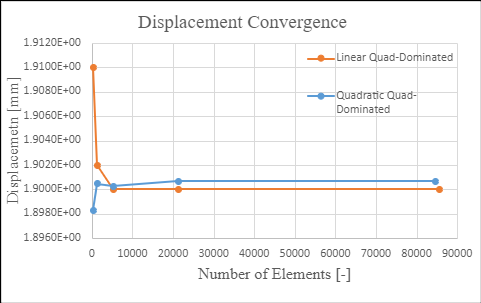
Mesh families: linear and quadratic elements were assessed with both tri-dominated and quad-dominated meshes. The convergence plots below track element count against peak von Mises stress and displacement.
03 / CONVERGENCE
Do the values stabilise?
Across the four mesh families, stress settled in the same general range and displacement approached 1.9 mm. Quadratic elements reached stable values with fewer elements in the comparisons reported.
04 / TAKEAWAY
Convergence builds confidence
The comparison shows why a single contour plot is not enough: element formulation and mesh density affect the result, so convergence is part of interpreting the analysis.
Quadratic elements gave a more efficient route to stable results in this study. The stress concentration appeared along the hook’s inner curve, consistent with bending through the curved section.
Model limits: the analysis assumes linear elasticity and 2D plane stress. The reported peak stress is a numerical result under those assumptions, not a validated safe working load; nonlinear material behaviour, 3D effects and further refinement would be needed for a design assessment. Global refinement was also limited by the academic software license.